Home
» Tips
»
How to Create a Simple Lead Tracking System in Excel Before Buying a CRM
How to Create a Simple Lead Tracking System in Excel Before Buying a CRM
The simplest useful Excel lead tracker has one row per lead, one controlled sales stage, and one required next follow-up date. If those three things are reliable, a small sales team can answer the questions that matter most: Who is this lead? Where are they in the pipeline? What happens next? When do we need to follow up?
You do not need to build a miniature CRM inside Excel before you know what your sales process actually needs. Start with one table, a few drop-downs, a follow-up rule, and a short weekly review. If the workbook remains accurate and no leads are slipping through, keep using it. If ownership, history, reminders, permissions, or automation become difficult to manage, that is a stronger reason to evaluate CRM software than an arbitrary lead-count threshold.
This guide uses features documented by Microsoft for current supported versions of Excel, including Excel Tables, data-validation drop-downs, filtering, structured references, conditional formatting, and the TODAY() function. Menu labels can vary slightly between Windows, Mac, and Excel for the web, but the workflow is the same.
Step 1: Create one clean lead table instead of several disconnected sheets
Start on a worksheet named Leads. Put one lead in each row and one type of information in each column. A practical starter set is:
Column
Purpose
Required at first?
Lead ID
A stable identifier such as L-001
Recommended
Date Added
When the lead entered your tracker
Yes
Name
Primary contact
Yes
Company
Organization, if applicable
Depends on your business
Email
Contact method
Use when available
Phone
Contact method
Use when available
Source
Website, referral, event, outbound, and so on
Useful
Lead Status
Current pipeline stage
Yes
Owner
Person responsible for the next action
Useful for teams
Next Follow-up
Date the lead needs attention again
Yes for active leads
Next Action
Specific next step
Yes for active leads
Notes
Short context that helps the next conversation
Optional
Once the headers are in place, convert the range to an Excel Table. Select a cell in the data and use Home → Format as Table, or use Ctrl+T where supported. Microsoft’s official table instructions explain that tables are designed to group and analyze related data. Table headers also get filter controls automatically, and formulas using structured references can expand as the table grows.
Name the table something readable such as Leads. This makes later formulas easier to understand. Microsoft documents structured references such as Leads[Lead Status], which adjust as rows are added or removed.
When this setup fits: you have one main pipeline, each lead can have one current owner, and a short note is enough to preserve context.
When it does not: one prospect can have many contacts, many simultaneous opportunities, detailed activity history, renewals, or complex account relationships. Those are signs that a relational CRM may eventually be easier than adding more and more columns.
Action: build the first table with no more columns than you can keep current after every sales conversation. A smaller accurate tracker is more useful than a large stale one.
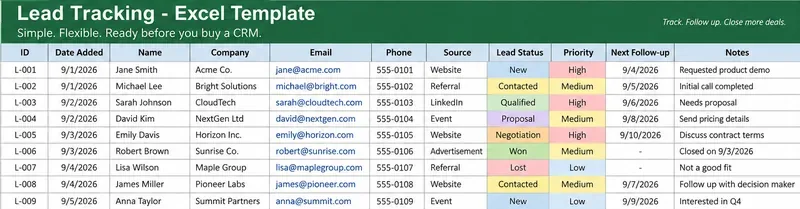
AI-generated spreadsheet illustration of a simple lead table. The names, companies, email addresses, dates, and sales activity are fictional examples, not a real Excel workbook or customer dataset.
Step 2: Standardize Stage, Source, and Owner with drop-down lists
Free-text status fields fail surprisingly quickly. One person enters “Follow up,” another enters “Follow-up,” and a third enters “Contacted.” Excel sees three different values, which makes filters and counts unreliable.
Create a second worksheet called Lists. Put your allowed stage values in one column. A simple pipeline might use:
New
Contacted
Qualified
Proposal
Negotiation
Won
Lost
Do the same for Source and, if multiple people sell, Owner. Then select the cells in the corresponding lead-table column and use Data → Data Validation → List. Microsoft’s drop-down list documentation notes that data validation helps people choose from a controlled list rather than entering inconsistent values. Microsoft also recommends storing the source options in a table when you want the list to update as items are added or removed.
Do not create fifteen stages because your CRM candidates have fifteen. Use stages that represent a meaningful change in the sales process. For example, “Qualified” should mean something your team can explain consistently, such as the prospect having a defined need, a credible buying path, and a next sales action.
When this setup fits: your pipeline stages are stable enough to describe in a short list, and the sales team can agree on what each stage means.
When to change it: if people repeatedly need different pipelines for different products, regions, or deal types, forcing all work into one shared status column can become misleading. That is a sign to redesign the workbook or consider a CRM with multiple pipelines.
Action: write one sentence defining each stage before creating the drop-down. If two team members would classify the same lead differently, the problem is the stage definition, not the spreadsheet.
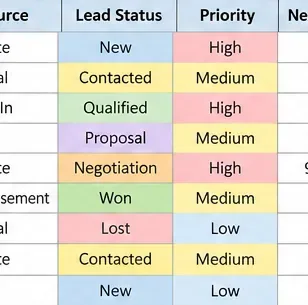
AI-generated illustration of standardized lead-status fields. The colors are visual examples only; the important part is using consistent values rather than free-text variations.
Step 3: Make Next Follow-up and Next Action the operating system
A lead tracker becomes useful when it tells you what to do today. That is why Next Follow-up and Next Action should be treated as operating fields, not optional notes.
After each meaningful interaction, update these fields before moving to another lead. A row might say:
Lead Status: Qualified
Next Follow-up: 9/18/2026
Next Action: Send pricing options and schedule 20-minute review
That is more actionable than a note such as “Interested; follow up later.”
Add an overdue flag
Add a column named Follow-up Flag. If your table is named Leads, a structured-reference formula can classify the date:
Microsoft documents that TODAY() returns the current date and can be used in date calculations. See the official TODAY function documentation. Because an Excel Table normally propagates formulas through a calculated column, you do not need to rebuild the formula manually for every new lead.
Then use Home → Conditional Formatting to highlight cells containing OVERDUE. Microsoft’s conditional-formatting documentation confirms that rules can format cells based on their values or on formulas.
Keep the rule simple. If the workbook turns into a rainbow of status colors, users may stop noticing the one condition that actually requires attention.
When this setup fits: every active lead has one clearly defined next step and one date when someone owns that follow-up.
When it does not: you need automatic emails, task reminders, recurring sequences, SLA timers, or activity logging from multiple communication channels. Excel can represent those items, but a CRM is usually better suited to automating and auditing them.
Action: make “no active lead without a next date and next action” your workbook rule. Review blank next-action fields before adding more dashboard features.
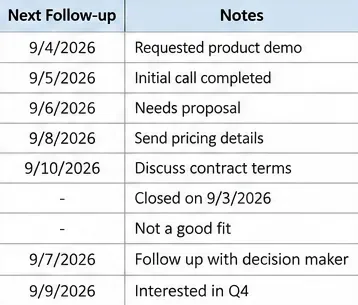
AI-generated illustration of follow-up dates and next-step notes. The dates and activities are fictional and are shown only to demonstrate the intended structure.
Step 4: Review the pipeline weekly—and use the review to decide whether you still need Excel
Once the tracker is dependable, add only the summary numbers that help you make decisions. A small Dashboard sheet can count leads by stage using COUNTIF:
Microsoft’s COUNTIF documentation defines the function as counting cells that meet a criterion. You can use those counts in a simple summary table or chart. Do not mistake the chart for the sales process; it is only a view of the underlying table.
For the weekly review, filter the table rather than manually copying leads into another sheet. Microsoft documents that an Excel Table automatically provides header filters, and the official filtering guide explains how to filter text, numbers, dates, blanks, and other criteria.
A 15-minute weekly review can follow this order:
Filter Follow-up Flag = OVERDUE. Every row needs a new date, action, or closed status.
Filter Lead Status = New. Check that each new lead has an owner and first action.
Review Qualified, Proposal, and Negotiation leads. Confirm the next action is specific.
Review Won and Lost. Close the loop so old deals do not remain in the active pipeline.
Look at Source counts only if you have enough consistent data to make the comparison meaningful.
When Excel is still enough: the workbook has one dependable owner or a small disciplined team, everyone can find the current record, updates happen after interactions, follow-ups are not being missed, and the manual work remains modest.
When to start evaluating CRM software: leads are duplicated, people overwrite each other’s information, ownership becomes unclear, follow-up reminders are routinely missed, reporting requires repeated manual cleanup, you need permissions by role, or sales activity must be connected automatically to email, calls, forms, or marketing systems.
There is no universal number such as “buy a CRM after 100 leads.” The breaking point depends on sales cycle complexity, number of users, number of simultaneous opportunities, compliance needs, integrations, and how much manual work your team tolerates.
Action: run the Excel system for a defined trial period—such as one or two sales cycles—and track three failure signals: missed follow-ups, duplicate/conflicting records, and time spent on manual administration. If those are increasing even though the workbook design is sound, compare CRM tools against those specific problems rather than shopping from a generic feature list.
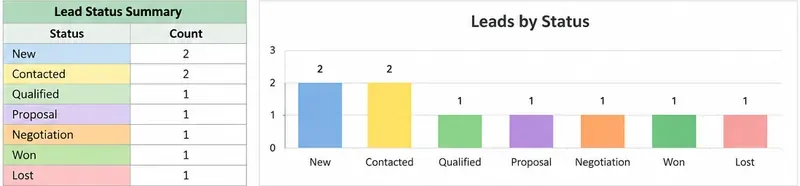
AI-generated illustration of a small pipeline summary. The counts and chart are fictional examples; build your own summary from the actual lead table rather than copying these numbers.
A practical starter layout you can copy
If you want the minimum viable version, use three sheets:
Sheet
Contains
Why it exists
Leads
One Excel Table with one row per lead
Single source of truth for active and closed leads
Lists
Stage, Source, Owner, Priority values
Feeds consistent drop-down options
Dashboard
Stage counts, overdue count, optional chart
Quick review without duplicating lead records
Avoid creating a separate sheet for each salesperson unless there is a strong reason. One shared table can be filtered by Owner, Stage, Source, or Next Follow-up date. Separate copies create reconciliation problems because the same lead may exist in more than one place.
What not to build before you know you need it
It is easy to spend a weekend adding macros, custom forms, automated email scripts, weighted pipeline forecasts, lead-scoring formulas, and elaborate dashboards. That can feel productive while making the workbook harder to maintain.
Before adding a feature, ask what decision it improves. A lead score is useful only if it changes who you contact or what you do next. An estimated deal value is useful only if you keep it current enough to support forecasting. A chart by lead source is useful only if Source values are entered consistently.
Excel is strongest here as a transparent, low-cost prototype of your sales process. It helps you discover which fields, stages, review habits, and reports you actually use. That knowledge makes a later CRM purchase better because you can evaluate software against a working process instead of guessing which features will matter.
Final self-check: is your lead tracker actually working?
After a few weeks, pick ten active leads at random and answer these questions without opening email or asking a coworker:
Who owns each lead?
What stage is each lead in?
What is the next action?
When is the next follow-up?
Which follow-ups are overdue today?
Can you distinguish Won and Lost deals from active ones?
Can two people apply the same stage definitions consistently?
If the sheet answers those questions quickly and the data is current, the simple Excel system is doing useful work. If the answers require searching inboxes, reading long notes, reconciling copies, or remembering what happened, add only the missing structure first. If the missing capability is automation, multi-user history, permissions, integrations, or relationship management rather than spreadsheet structure, that is the point where a CRM deserves serious consideration.